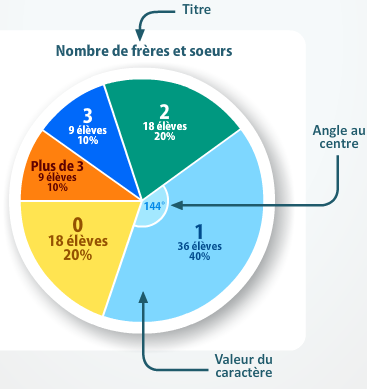
Diagram in the form of a circle in which each modality of a distribution of the data of a qualitative statistical variable occupies one sector of the circle (identified by a percentage or a fraction) where the area is proportional to the frequency of the modality.
Example
| Here is some data we gathered by surveying students in a class to find out the number of brothers and sisters in each family.
|
 |
